My token bill was 20% higher than my Claude Code transcript
Published
Hello! I left one Claude Code session running overnight (from the morning of the 26th of August to about 7:30 the next morning) pointed at a third-party model provider rather than Anthropic: an Alibaba Model Studio subscription, the thing they call a Token Plan. Then the usage dashboard told me I'd spent 321 million tokens, and my honest first reaction was that I was being had. I'd picked up the idea somewhere that these subscriptions inflate usage — I can't now find the thread I got it from, so treat that as a vibe I absorbed rather than a claim I'm making — and 321 million is a number with no intuition attached to it whatsoever, so I was extremely ready to believe the worst.
The nice thing about Claude Code (which I've been leaning on for a while now, including for building HubSpot themes in web sessions) is that it writes every single API response it gets into a transcript on disk, token counts included, so I don't have to argue with a dashboard from a position of ignorance. I can just count them myself. So I did. I got 264 million, and the bill was 20% above that, which turns out to be a much less interesting answer than "scam".
the counts are already in the Claude Code transcript, in two places
Claude Code keeps a JSONL transcript per session under ~/.claude/projects/, and the thing I nearly missed is that it's not one file. The main conversation is one .jsonl, and every subagent gets its own file in a subagents/ directory beside it:
~/.claude/projects/<project>/
  89f51468-fd8b-4254-bc6e-378eeb4a09a7.jsonl      the main thread, 4.5 MB
  89f51468-fd8b-4254-bc6e-378eeb4a09a7/
    subagents/
      agent-a02763a27daaddb79.jsonl               one file per subagent
      agent-a02763a27daaddb79.meta.json
      ... 48 of them
This mattered more than anything else in the whole exercise. My main thread made 481 API calls. The 48 subagents made 2,973 between them, and they accounted for about 80% of the tokens. If I'd counted only the file with the session id on it (which is the obvious thing to do, it's the one that looks like "the transcript") I'd have come up 210 million short and concluded I was being overbilled by nearly 6×.
Inside those files, every assistant message carries the provider's own usage accounting:
{
  "type": "assistant",
  "timestamp": "2026-08-26T23:59:19.032Z",
  "message": {
    "id": "msg_78d8fb9d-24cb-4ba4-b620-76e0e8832f44",
    "model": "qwen3.7-max",
    "usage": {
      "input_tokens": 6,
      "cache_creation_input_tokens": 10909,
      "cache_read_input_tokens": 12367,
      "output_tokens": 49,
      "service_tier": "standard",
      "cache_creation": {
        "ephemeral_5m_input_tokens": 10909,
        "ephemeral_1h_input_tokens": 0
      }
    }
  }
}
Four buckets, and they're priced differently, so I kept them apart: input_tokens is fresh prompt, cache_creation_input_tokens is prompt being written into the cache, cache_read_input_tokens is prompt served from it, and output_tokens is what came back. Anthropic's prompt caching docs define them (Model Studio is answering in Anthropic's response shape here, so those are the definitions I'm holding it to) and the definition of the first one is the load-bearing bit for everything below: input tokens which were not read from or used to create a cache. So a cache write is not counted as fresh input. It's its own bucket.
my first count of the output was wrong by nearly 3,000×, in the direction I wanted
My first pass deduplicated on message id (one row per API call, which is obviously right) and kept the first row it saw for each. It gave me 70 million input tokens and 391 output tokens across all the subagents. 391! For 48 agents that worked all night. That's obviously broken, and it's broken in a way I want to flag, because a less absurd version of the same bug would have looked completely plausible — and because it was broken in my favour. An undercount on my side is exactly what a padded invoice looks like.
The transcript records streaming, so one API call shows up as several rows sharing a message id, and the early rows are partial — they carry an estimate of the prompt size and nothing else. Only the final row has the real split:
# three rows, one message id, and only the last one is real
# (the enclosing "message": { ... } is elided here — see the full row above)
{"id":"msg_f61a...","usage":{"input_tokens":23168,"output_tokens":0}}
{"id":"msg_f61a...","usage":{"input_tokens":23168,"output_tokens":0}}
{"id":"msg_f61a...","usage":{"input_tokens":6,"cache_creation_input_tokens":2242,
                             "cache_read_input_tokens":23276,"output_tokens":258,
                             "service_tier":"standard"}}
So the first row is the partial one, and keeping it throws away the whole real accounting — that's where the 391 comes from. Summing every row instead, which is what I tried next, is wrong in the other direction: it counts each partial estimate as though it were a separate call, and turns 63,154 real fresh input tokens into 97 million. What you want is the last row, or safer still, the most complete one. My scoring rule is that partials have no cache fields and no output, so they score zero and always lose:
import fs from "node:fs";
import path from "node:path";

// Two dedup hazards:
//   1. streamed rows repeat a message.id, and the early ones are partial
//   2. resumed/forked sessions re-copy earlier rows into a new file
// So: key globally on message.id, keep the most complete record. Partials
// carry no cache fields and no output, so they score 0 and always lose.
const seen = new Map();

function tally(file) {
  for (const line of fs.readFileSync(file, "utf8").split("\n")) {
    if (!line.trim()) continue;
    let o; try { o = JSON.parse(line) } catch { continue }
    const m = o.message, u = m && m.usage;
    if (!u || !m.id || m.model === "<synthetic>") continue;
    const rec = {
      model: m.model,
      day: (o.timestamp || "").slice(0, 10),
      input: u.input_tokens || 0,
      cacheWrite: u.cache_creation_input_tokens || 0,
      cacheRead: u.cache_read_input_tokens || 0,
      output: u.output_tokens || 0,
    };
    const score = rec.cacheRead + rec.cacheWrite + rec.output;
    const prev = seen.get(m.id);
    if (!prev || score > prev.score) seen.set(m.id, { ...rec, score });
  }
}

// takes the session .jsonl, with or without the extension
const SESSION = process.argv[2].replace(/\.jsonl$/, "");

// the main thread...
tally(SESSION + ".jsonl");
// ...and every subagent, which is where most of the money went
const dir = path.join(SESSION, "subagents");
for (const f of fs.readdirSync(dir)) if (f.endsWith(".jsonl")) tally(path.join(dir, f));
Deduplicating globally rather than per-file matters too, because a session that gets resumed or forked copies its earlier rows into the new file, and those are the same billed calls appearing twice. None of this is a supported interface, mind — Anthropic's sessions docs say the entry format is internal to Claude Code and changes between versions, so scripts that parse it can break on any release. The directory layout is on firmer ground than I assumed: the sub-agents docs give the subagents/ path and the agent- filenames. What isn't documented anywhere I could find is the .meta.json sidecar beside each one, which is the file the last section of this post leans on. So I'd re-run this against a fresh session before trusting it, and I'd expect to have to fix it eventually.
convincing myself I hadn't quietly lost half of it
An undercount was the failure mode I was most worried about, so I checked four things before I trusted my own number.
Are the records complete? I found a final, complete usage record for all but two of the message ids in the transcripts. Those two had partial rows only, worth about 45,000 estimated prompt tokens between them — 0.02% of the total. So whatever else is going on, it isn't that the transcript is full of holes.
Did every subagent leave a file? I could find 57 distinct task ids referenced across the transcripts against only 48 files on disk. That gap looked like exactly the smoking gun I was after — nine agents that burned tokens and left no record. It wasn't. All nine turned out to be background shell tasks, things like sleep 30 and a Monitor loop waiting on a git command. Zero tokens, correctly absent.
Was this provider used anywhere else that week? The transcripts record a model name per call, and qwen3.7-max and qwen3.8-max appear in this one session and nowhere else on the machine — every other project I touched that week was running Anthropic models. So the dashboard and my count should be looking at the same work.
Are we even agreeing on what a day is? If the dashboard's day boundary isn't UTC then work shuffles between its two bars and the comparison gets muddier. The dashboard puts 56.27% of the two days on the 26th; I get 59.73% at UTC and 52.95% at UTC+1, so it's UTC or British Summer Time and I can't tell which. Which is fine, because either way the boundary moves work between days — it can't create any.
96% of it was the same context being read again
3,454 API calls over about 21 and a half hours. The main thread ran qwen3.8-max, and every subagent ran qwen3.7-max:
| Calls | Fresh input | Cache write | Cache read | Output | |
|---|---|---|---|---|---|
| Main thread | 481 | 2,886 | 5,740,352 | 48,413,590 | 275,387 |
| Subagents (48) | 2,973 | 63,154 | 4,245,079 | 204,549,209 | 1,089,940 |
| Total | 3,454 | 66,040 | 9,985,431 | 252,962,799 | 1,365,327 |
264,379,597 tokens all in. The shape of it is the part I find weirdest: 96% of everything is cache reads, and fresh input is 66,000 tokens — 0.025% of my count. Almost nothing I did that night was new text. It was the same context being re-read thousands of times, which is what an agent loop is, and I think it means the only pricing number I should have been looking at is what a cache hit costs.
the dashboard only gives me three totals, so I subtracted for the other two
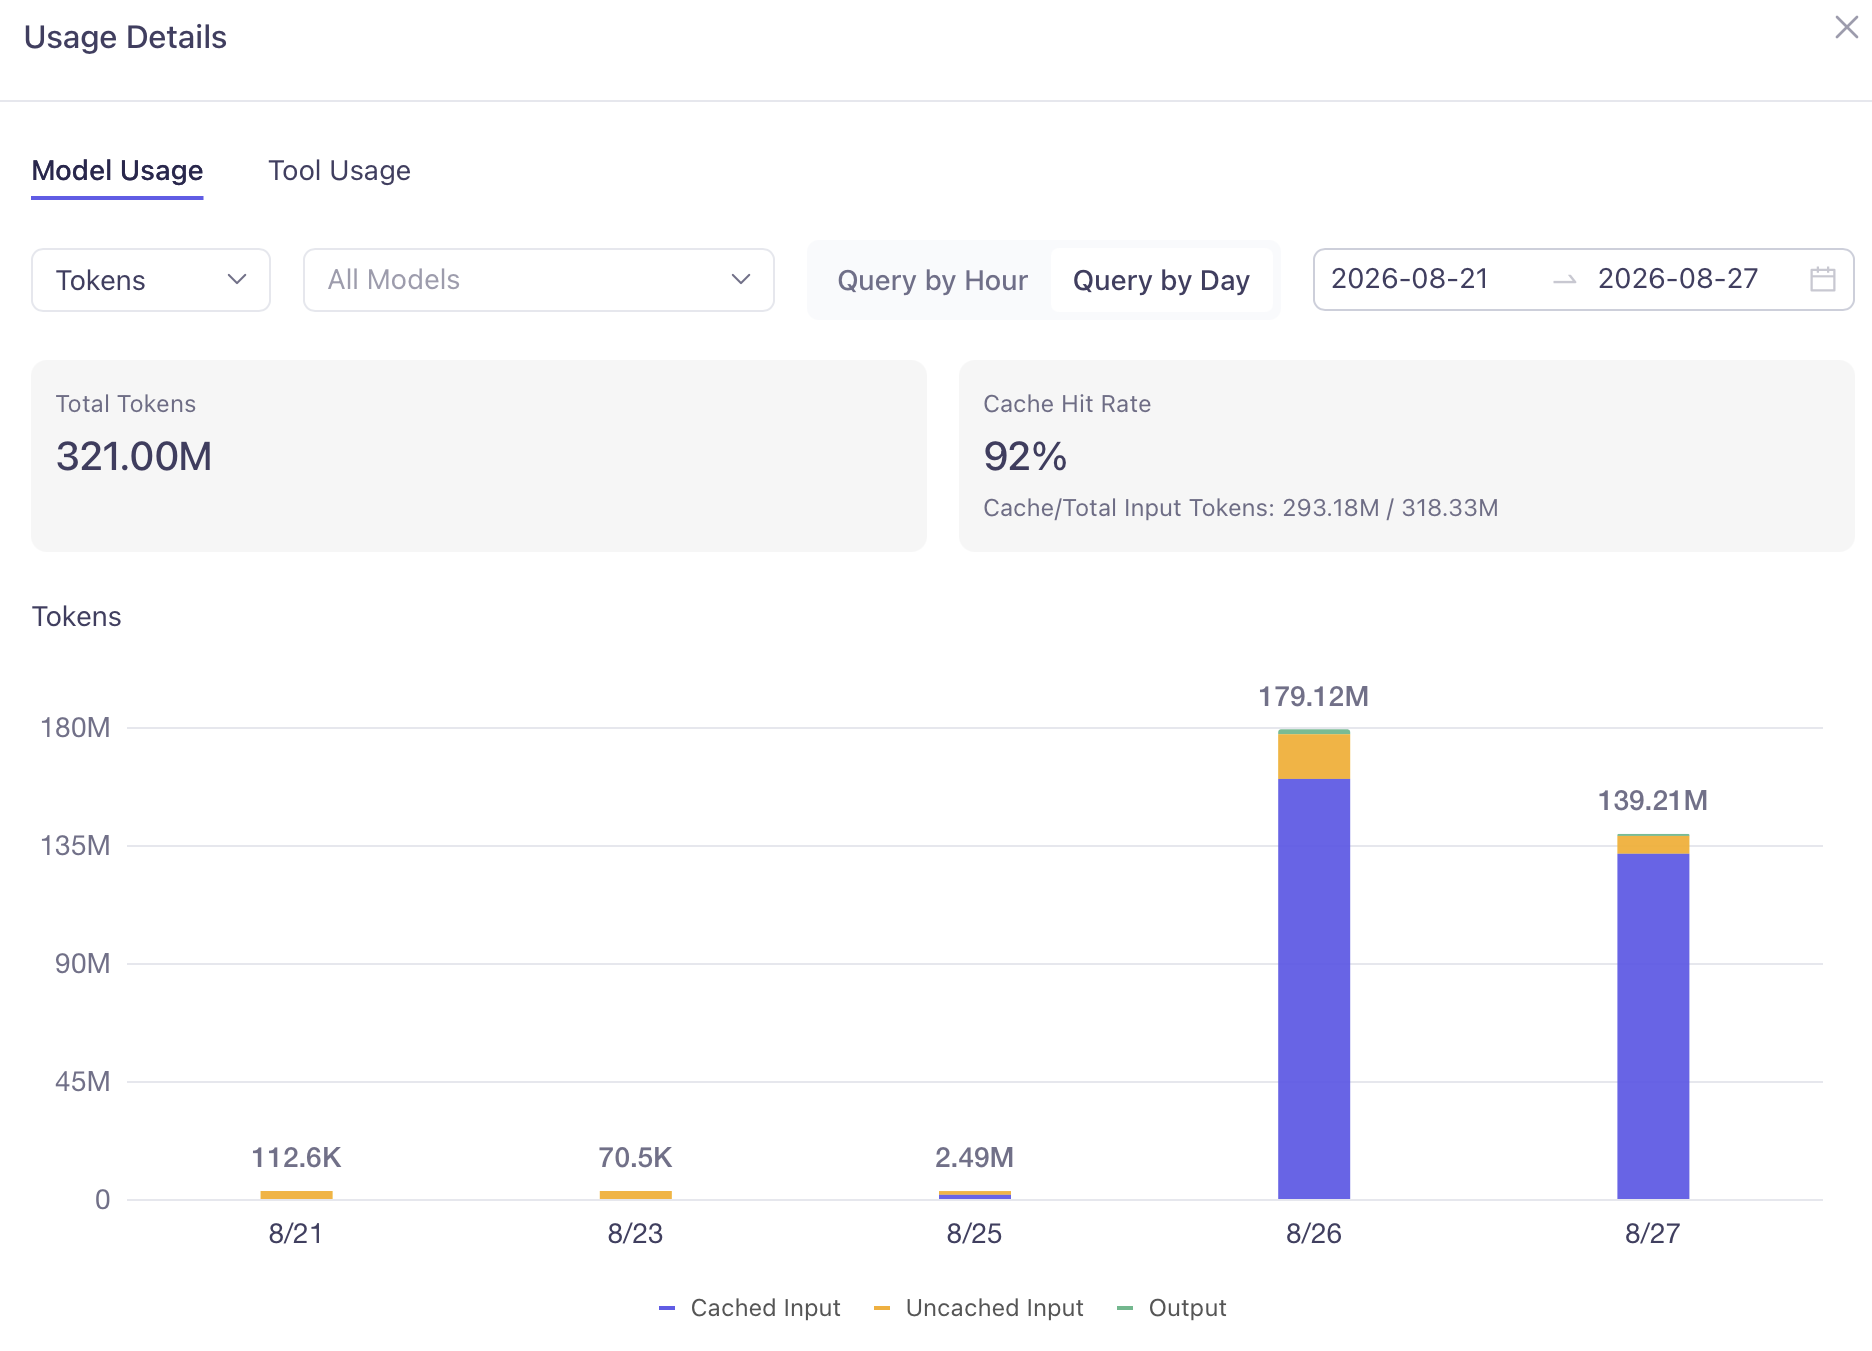
I can only read three totals straight off it (321.00M total, and a cache line reading 293.18M / 318.33M) so I got the other two by subtraction: uncached input is 318.33 minus 293.18, so 25.15M, and output is 321.00 minus 318.33, so 2.67M.
The daily bars sum to exactly 321.00M, which is a small reassurance that I'm reading the chart the way it's meant to be read. Three of those days aren't mine at all: the session started on the 26th, so the 112.6K on the 21st, the 70.5K on the 23rd and the 2.49M on the 25th are something else — 2.67M in total, which leaves 318.33M for the two days that are mine. Annoyingly that's the same 2.67M I just derived as output, and the two have nothing to do with each other — sorry, they really are different quantities that happen to be equal.
the gap isn't spread evenly across the three rows
Lining the dashboard's three buckets up against mine is where one gap turns into three:
| Dashboard | My count | Delta | |
|---|---|---|---|
| Cached input | 293.18M | 252.96M | +40.22M (+15.9%) |
| Uncached input | 25.15M | 10.05M | +15.10M (+150%) |
| Output | 2.67M | 1.37M | +1.30M (+95%) |
| Total | 321.00M | 264.38M | +56.62M (+21.4%) |
The uncached row assumes the dashboard counts cache writes as uncached input, which is the reading I'd expect since a write isn't a hit. If they lump writes in with cached instead, the split moves — cached +30.23M, uncached +25.08M — but the total is the same either way. Dropping the 2.67M from days that aren't mine, it's 318.33M against 264.38M, so the dashboard is 20.4% high. That correction only comes off the total, though — the chart won't tell me how those 2.67M split across the three buckets, so the three row deltas are each very slightly overstated.
what I actually think is going on, with decreasing confidence
Requests that were ingested and never came back. A prompt that gets read and then hits a rate limit, or a stream that dies partway, costs the provider the input and leaves absolutely no row in my transcript (my count can only see requests that returned). The extra 55M of input over 3,454 calls works out at roughly 700 more calls at this session's average prompt size, so about 17% of attempts failing, counting those 700 alongside the 3,454 that came back. That's high but not outlandish for an overnight run hammering one endpoint, and I did restart Claude Code at one point with agents still in flight.
Reasoning tokens that don't show up in output_tokens. This was my favourite right up until I went and read the docs, because of one specific number: the dashboard's output is about 1.96× mine. Not the ~20% the total comes to, nearly exactly double. That's the signature I'd expect if the response reports visible output while the invoice counts visible output plus reasoning. This ran a thinking model at high effort all night, so there'd be a lot of it. It only accounts for 1.3M of the 56M gap, mind: it explains the shape of the output row, not the bulk of the money.
Then I read the docs, and they are a point against me twice over. The provider's own deep thinking docs have an example response with completion_tokens of 221 and reasoning_tokens of 172 nested inside completion_tokens_details (10 prompt plus 221 completion makes their stated total of 231) so on that endpoint the thinking is already in the output count rather than added to it. I'd been treating that as survivable, because it's the OpenAI-shaped endpoint and Claude Code talks to the Anthropic-shaped one, where the usage object I showed earlier has no reasoning field in it at all. It turns out the shape has one and this provider just isn't sending it. Anthropic's thinking docs describe usage.output_tokens_details.thinking_tokens as reporting how many of the billed output tokens were internal reasoning: inside the output count, same as the OpenAI shape. So both specs say the thinking is already in the number, my nicest theory has no mechanism left, and the 1.96× is still sitting there with nothing to explain it.
Something in the metering I can't see. Rounding per call, counting a cache write at a multiplier, a chat template the client doesn't know about. I have no evidence for any of these and I'm listing them because "I don't know" deserves a row.
I don't think 20% is a scam, and I'd have liked it to be
I went in wanting the dramatic version. But the numbers don't have the right shape for it. Inflating usage is worth doing at 3× or 10×, but at 20% you're taking on all the fraud risk for a rounding error, and 20% is comfortably inside what you'd get from honest disagreements about what counts as a token. Reasoning tokens alone looked like a genuinely murky line until I read both sets of docs, and then the murk turned out to be documentation rather than accounting: this vendor spells out how it counts on one of its two endpoint shapes and not the other, and I haven't looked at anybody else's.
And I have to be straight about the direction of my own error bars. My number is a floor, by construction. The transcript only knows about requests that produced a response. Every retry, every aborted stream, every request that timed out after the prompt was already read is invisible to me and legitimately billable. So "the dashboard is 20% above my floor" is a much weaker accusation than it sounds like, and the true gap is smaller than 20%.
What would change my mind: an hourly breakdown showing the excess arriving in a lump rather than spread evenly, which would mean something specific happened rather than a metering policy I don't like. That's the next thing I'll look at. I'd also just like a straight answer to the question the docs didn't cover: do requests that are ingested and never come back, rate-limited or aborted or timed out, get billed? I couldn't find a page on either side that says, and that answer collapses most of this.
the cheap-model routing I thought I was getting doesn't happen
Here's a second thing I found while I was in the transcript, which is about price rather than count, so it doesn't move any of the numbers above. Claude Code lets you spawn a subagent with a model alias — haiku, sonnet, opus — so the cheap mechanical work goes somewhere cheap and only the hard thinking runs on the expensive model. I use it a lot.
It didn't do anything. Of the 48 subagents, I spawned 32 with an explicit alias (15 haiku, 9 opus, 8 sonnet) and every single one of them was answered by qwen3.7-max. So were the other 16, the ones I spawned with no alias at all. The alias is in the spawn metadata and the billed model is in the transcript beside it, and they just don't agree:
# what I asked for — subagents/<id>.meta.json
{"agentType":"general-purpose","description":"...","name":"...",
 "toolUseId":"toolu_9b4d3a1b78144630ba0c18b0","spawnDepth":1,"model":"haiku"}

# what answered, and what the bill is against — subagents/<id>.jsonl
{"message":{"id":"msg_78d8fb9d-24cb-4ba4-b620-76e0e8832f44",
            "model":"qwen3.7-max","usage":{...}}}
That's the same message id as the usage record I showed near the top of this post — the first example in this piece turns out to be one of these. There is some routing going on, the main-thread-versus-subagent split I noted up top, but it has nothing to do with what I asked for, and both models in it are max models. Asking for haiku got me the same model as asking for opus.
Those 32 subagents account for 2,428 of the session's 2,973 subagent-scoped calls, so this isn't a corner of the run, it's most of it. What I have not done is work out what that cost me. I'd need this provider's per-tier rates and a sensible guess at what the work would have looked like on a genuinely smaller model, and I haven't sat down and done either — I only confirmed the routing doesn't happen. So: an open question, not a number. If you want a number, don't take one from me.
I went looking for whose gap this was, and it's mine. Claude Code has a CLAUDE_CODE_SUBAGENT_MODEL setting, and its model configuration docs say it sets the model for all subagents and overrides the per-invocation model parameter and the subagent definition's model frontmatter. Model Studio's own Claude Code setup page hands you a settings block to paste in, and for my plan that block sets ANTHROPIC_MODEL to qwen3.8-max and CLAUDE_CODE_SUBAGENT_MODEL to qwen3.7-max, which is exactly the split I found. A few lines above the override, the same block resolves the aliases themselves: haiku to qwen3.6-flash, and sonnet and opus both to qwen3.8-max. So the cheap model was configured and then switched off in the same paste, and the other two aliases were pointing at the same model as each other anyway. My session's environment carries two more values from that block verbatim, so I'm confident that's where mine came from.
So nobody ignored my alias. I overrode it myself, at setup, with a line I didn't read, and then spent an evening building a case against the provider. The fix is in the same docs — CLAUDE_CODE_SUBAGENT_MODEL takes inherit, which puts normal model resolution back — but I'd rather you took the general version: check your own settings before you check anyone else's billing. Checking the routing is one grep: read the model out of a meta.json, read the message.model out of the transcript next to it, and see whether they match.
oh, and don't publish your raw transcript
I was going to attach the whole 4.5 MB session transcript to this post, because it's the actual evidence and you should be able to check my arithmetic. Then I grepped it for credential patterns first, the way you do, and found a full unredacted GitHub personal access token sitting in it — some tool had run env and the transcript faithfully recorded the output, as it records everything.
Which is obvious in hindsight! A transcript is a recording of your terminal, and your terminal has your secrets in it. I don't think I'd have thought about it if I hadn't been about to push the file to a public repo. So I'm attaching the derived data instead: one line per API call with the message id, timestamp, model, whether it was the main thread or a subagent, and the four token counts, and nothing else. It's everything you need to reproduce the table and none of the conversation.
- usage.jsonl — 3,454 records, one per API call
- count-tokens.mjs — the script, pointed at your own
~/.claude/projects/
If you run it against your own sessions I'd love to know whether your dashboard agrees with your transcript better or worse than mine did, and if you spot a bug in how I'm deduplicating those streaming rows I would very much like to hear about it, because I've now been wrong about it twice.